


Introduction
In my 12+ years in digital marketing, I’ve seen that data standardization is often overlooked, but it’s a key step in marketing science for building reliable predictive models.
In marketing, we often deal with features on completely different scales: ad spend in euros, session duration in seconds, product views as counts. If you feed these raw values into clustering or regression models, your results will be biased and misleading.
That’s where Z-score standardization comes in. It’s a simple but powerful way to normalize your data using Python’s Pandas, Scikit-learn libraries or even Excel, and it’s a must-have step before applying any technique that depends on distance, variance, or scale.
In this post, you’ll learn:
- What Z-score standardization is and why it matters
- How to apply it with Pandas and Scikit-learn
- Marketing use cases when it is needed (like in KMeans, PCA, or Linear Regression)
Whether you’re a marketer learning Python or a growth freelancer preparing a predictive audit, this foundational technique will help you build smarter, cleaner models, and get closer to decisions that actually reduce CAC.
Let’s dive in 🙂
Why Standardizing Data Matters Before Prediction in Marketing
What is Data Standardisation?
When I first started learning about marketing data science in 2023 studying this beautiful book from Baig, et al. I’ll be honest I didn’t really get the point. I kept thinking: why do I need to apply this extra step after cleaning the data?
Data standardization is basically the process of converting values into a uniform scale, making different features comparable and easier to process for algorithms. After you’ve cleaned your DataFrame (removed missing values, outliers, etc.), standardizing ensures that your model doesn’t get biased by features with different units or scales.
In the context of marketing analytics, data standardization is a preprocessing technique that transforms features (ie. media spent, CTR, Session Time, AOV) to make them comparable and balanced between dataframes. Specifically, it rescales each numeric feature so that:
- The mean becomes 0;
- The standard deviation becomes 1
Standardizing data can enhance data quality and accuracy, which helps make reliable data-driven decisions so it aligns all variables to the same statistical scale.
Why do you need to standardise data? In marketing data, you may need to work with features of different scale, like:
- Ad spend (thousands of euros)
- Session time (in seconds)
- Email opens (simple counts)
If you feed them directly into a machine learning model, the algorithm might overweight the features with the largest values (Ad Spend or time), even if it’s not the most important one.
Normalization vs. Standardization
Before we go any further it is important to clarify the difference between: Normalisation vs. Standardisation. Both tactics are used to transform data into an uniform and consistent format, but they differ in how they achieve this.
Normalisation involves scaling data values in a range between 0 and 1 ([0, 1]) or -1, Data normalization typically involves scaling data down to a smaller range of values, such as between 0 and 1.
Normalization scales data to a standard range, like [0, 1] or [-1, 1], ensuring consistency for analysis and machine learning. [0, 1] works for positive data, while [-1, 1] preserves sign and centers values around zero.
Standardization transforms data to have a mean of 0 and standard deviation of 1, ideal for algorithms assuming Gaussian distributions (e.g., PCA, SVMs). Unlike normalization, it handles outliers better but doesn’t bound values to a specific range.
For instance, consider a scenario of data standardization where we want to use income (y-axis) and age (x-axis) of customers as attributes for clustering. Plotting these attributes on the same graph may pose a problem due to the inherent differences in their scales. Income values might range in the thousands or millions, while age values are typically much smaller. The disparity in scale could lead to biased clustering results, as the clustering algorithm may give undue weight to the attribute with larger values (in this case, income) (Baig, 2022).
Standardise with Pandas Z-Score for Marketing
Among various data rescaling techniques, one simple and widely used method is the Z-Score. However, the selection of the appropriate data standardization approach relies on your data’s specific needs. Alternative methods include Min-Max Scaling, Robust Scaling, Max Absolute Scaling, LogTransformations, Quantile Transformation, PowerTransformation.
Z-Score Formula Explained
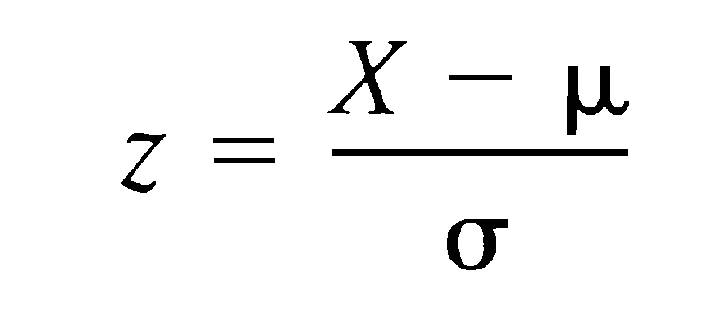
Nominator
- First, calculate the mean (μ) of the column.
- Then subtract the mean from each value. This centers your data around 0.
Denominator
- Calculate the standard deviation (σ), which measures how spread out the values are.
- Divide each centered value by the standard deviation. This scales the data so that all features have the same statistical weight.
Why this Formula Works?
By applying this transformation across your columns, for example, ad_spend, sessions, and purchases, you’re ensuring that your data are comparable across metrics, even if the original units were totally different:
After this tranformation, we ensure every feature has a mean of 0 and a standard deviation of 1. A change of “+1” means the same intensity across all variables
You can use Z-scores to detect outliers, identify top customers, or clean your dataset before building predictive models.Z-scores follow the Empirical Rule from statistics, which helps interpret how far a value is from the mean — especially when your data follows a normal distribution (a bell-shaped curve). When a Z-score is close to 0, the behavior is considered normal. But when a value has a Z-score of +3.8, it’s far from the average.
That could signal an outlier, or it could be one of your top spenders.
In traditional statistics, anything above +3 is flagged as unusual — but in marketing, context is everything.
Sometimes the outliers are exactly the customers you want to find.
- A Z-score of 0 means the value is exactly the mean
- A Z-score of 1.5 means it’s 1.5 standard deviations above the mean
- A Z-score of -2 means it’s far below the average
Pandas Z-Score Code Example.
Now take a look for the Python Pandas implementation. We will use the StandardScaler with scikit-learn:
import pandas as pd
import numpy as np
from sklearn.preprocessing import StandardScaler

#Step 2: Load your data into a pandas DataFrame
df = pd.read_csv('your_data.csv')

#Step 3: Preprocess the data and select the columns to be standardized
#We want to standardize 'column1' and 'column2'
columns_to_standardize = ['column1', 'column2']
data_to_standardize = df[columns_to_standardize].values

#Step 4: Initialize the StandardScaler object
scaler = StandardScaler()

#Step 5: Use the fit method to compute the mean and standard deviation
scaler.fit(data_to_standardize)

#Step 6: Use the transform method to standardize the data
standardized_data = scaler.transform(data_to_standardize)
Now your new variable ‘standardized_data‘ contains the standardized values of ‘column1’ and ‘column2’ to be used for further analysis and modelling.
PS: do not forget you can appply Z-Score method directly in MS Excel!
Real Marketing Applications
In predictive marketing, data standardization becomes essential often any time you’re working with features on different scales and applying models that rely on distance, variance, or numerical comparison. Here are the most common cases where you should standardize your data:
1. KMeans for Clustering for Customer Segmentation
In my experience, this is the most useful and frequent reason to standardize data in marketing analytics. I’ve used KMeans many times when segmenting customers, especially when working with behavioural and transactional data together. Click here to see an example. The challenge? KMeans relies on Euclidean distance to form clusters, which means features with larger numerical ranges dominate the outcome.
2. Linear Regression to predict sales or CAC
Without standardization, the regression coefficients become hard to interpret, and large-scale features might dominate the model unfairly. Standardizing makes it easier to compare impact across variables, especially when doing performance attribution.
3. PCA to simplify your dataset
Principal Component Analysis looks for directions of greatest variance in the data. If some features vary more just because of their scale (not importance), PCA will give them too much weight. Standardizing before PCA keeps your components balanced and meaningful.
4. Scoring users or calculating LTV via regression
If you’re using regularized regressions (like Ridge or Lasso) for scoring or forecasting, features with larger scales will be penalized less unless standardized — leading to poor variable importance and incorrect prioritization.
When Standardization Is Not Necessary in Marketing Models
Not every model benefits from standardization. Tree-based algorithms, like Random Forest, Decision Trees, and Gradient Boosting, are invariant to scale. They split the data based on thresholds, not distance. So whether you’re using euros or seconds, the logic still holds.
Similarly, Logistic Regression doesn’t require standardization to function, but if you’re comparing coefficients or want to optimize convergence, it’s often recommended.
Conclusion
In this hands-on walkthrough, I explored the importance of data standardization and how it connects directly to real-world marketing analytics. I shared my perspective about the importance of data standardization and my working experience learned for marketing analytics in Pandas.
Standardizing data plays a very improtant role in various data analysis and machine learning tasks if we want to perform predictive customer segmentation in clustering using different features.
When working with features like income and session time in the same dataset, differences in scale can seriously skew your results. Standardizing those features onto a common scale ensures that every variable contributes fairly, making your models more reliable and your insights more actionable.
The Z‑Score method, often implemented via StandardScaler from scikit-learn, is one of the most popular tools in Python in Pandas for this job. It transforms your data into a distribution with mean = 0 and standard deviation = 1, making it easier to understand how far each data point is from the average — a key step in many predictive workflows.
In short: standardizing your data isn’t just a technical detail, it’s a strategic advantage. It improves model accuracy, helps you compare variables clearly, and leads to better decisions when you’re optimising marketing performance or forecasting customer behaviour.
Let’s keep in touch and Reach out to me if you have any questions!
Bibliography
Diaz-Bérrio, G. (2024). Data analytics for marketing: A practical guide to analyzing marketing data using Python (1st ed.). Packt.
Govindan, G., Baig, M. R., & Shrimali, V. R. (2021). Data Science for Marketing Analytics: A Practical Guide to Forming a Killer Marketing Strategy Through Data Analysis with Python. Packt.
Hadley, W., & Grolemund, G. (2016). R for data science: Import, tidy, transform, visualize, and model data. O’Reilly Media.
McKinney, W. (2018). Python for data analysis: Data wrangling with Pandas, NumPy, and IPython. O’Reilly Media.
Paskhaver, B. (2021). Pandas in Action. Manning Publications.
VanderPlas, J. (2016). Python data science handbook: Essential tools for working with data. O’Reilly Media.
Wickham, H., & Grolemund, G. (2017). R packages: Organize, test, document, and share your code. O’Reilly Media.
Zaki, M. J., & Meira Jr, W. (2014). Data mining and analysis: Fundamental concepts and algorithms. Cambridge University Press.